
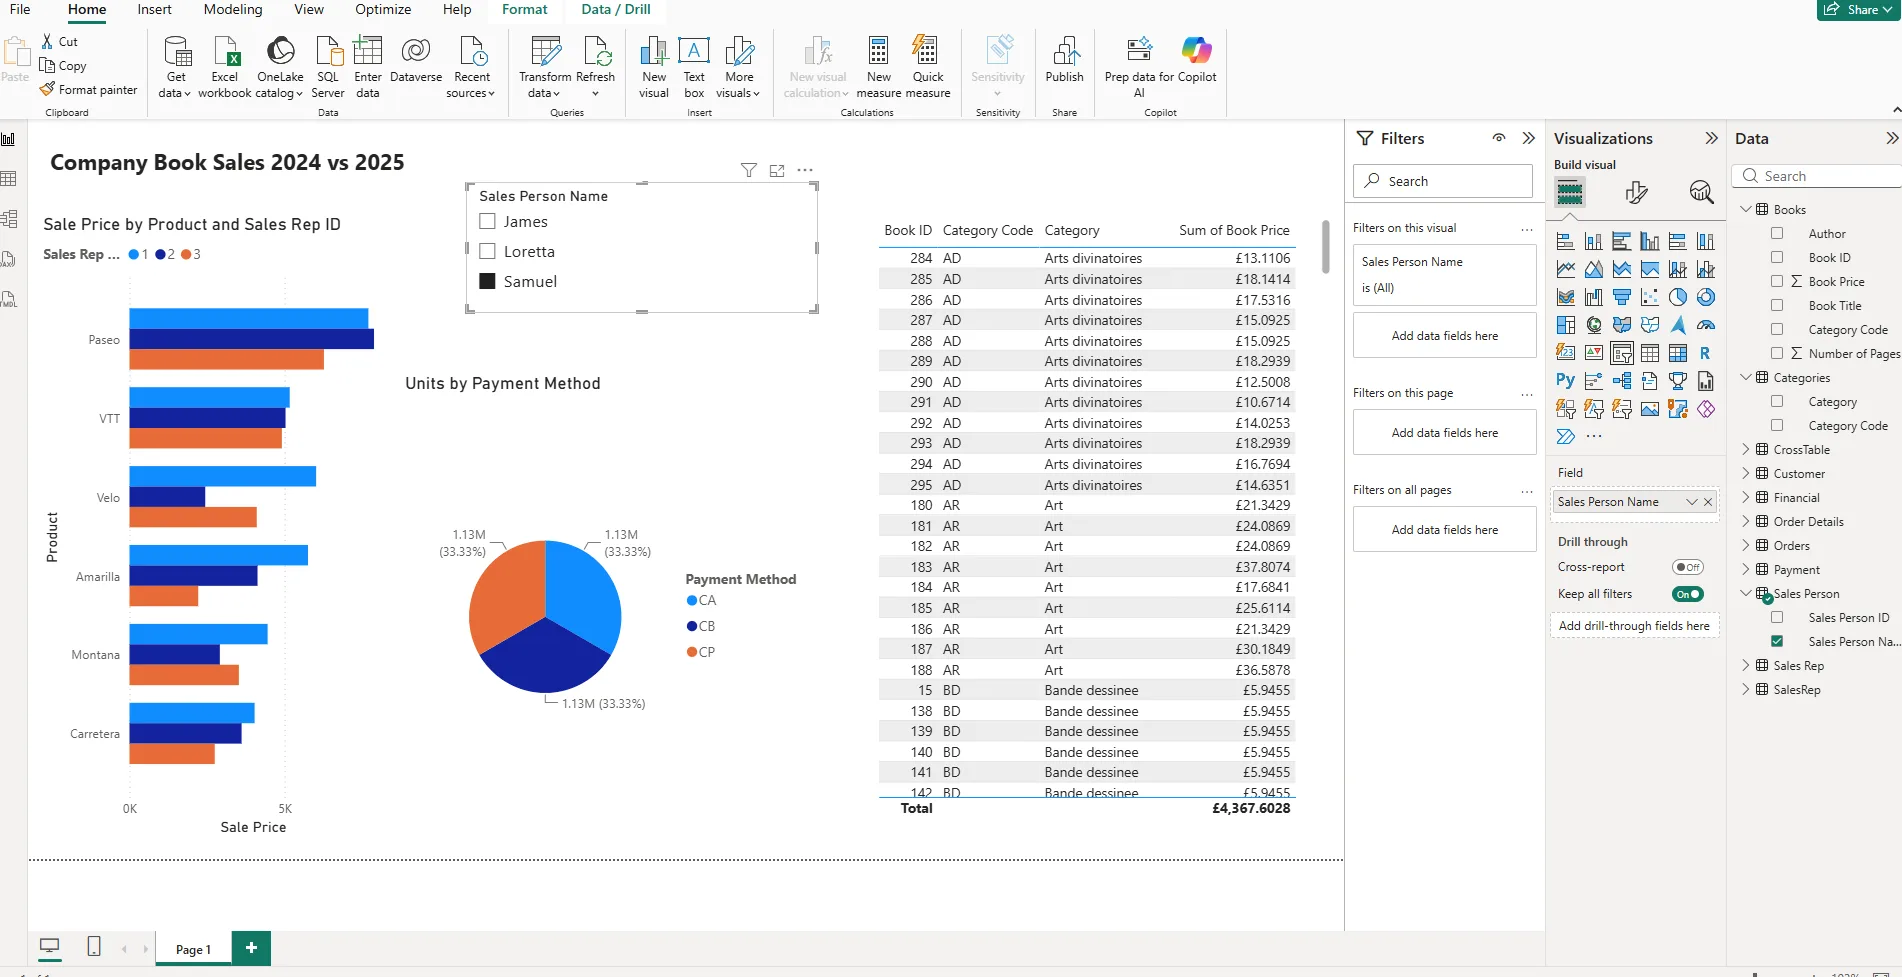
1. Consolidates scattered data
Pulls from Excel, SQL databases, SharePoint, Dynamics, Salesforce, Google Analytics, etc. into one place. no more manually copying numbers between systems.
2. Replaces static reports with live dashboards
Instead of a monthly Excel report someone rebuilds by hand, you get a dashboard that auto-refreshes and updates in real time (or on a schedule).
3. Surfaces patterns you'd miss in raw tables
Trend lines, YoY comparisons, drill-downs. lets you (or non-technical staff) explore data interactively rather than just reading a fixed summary.
4. Controls who sees what
one dashboard can serve your whole team . each person or region only sees their relevant slice, without building separate reports.
Concrete business use cases:
Sales pipeline tracking (by rep, region, product)
Cash flow / financial monitoring
Inventory or stock-level alerts
Customer churn or support-ticket trends
Marketing spend vs. conversion tracking



Comments